If you are (super-)rich, you probably are more harmful to environment and climate than average Jane Doe. At the same time, your potential to combat the climate crisis is massive.
So what could you do? Here is a chart for some orientation. Data is provided below.
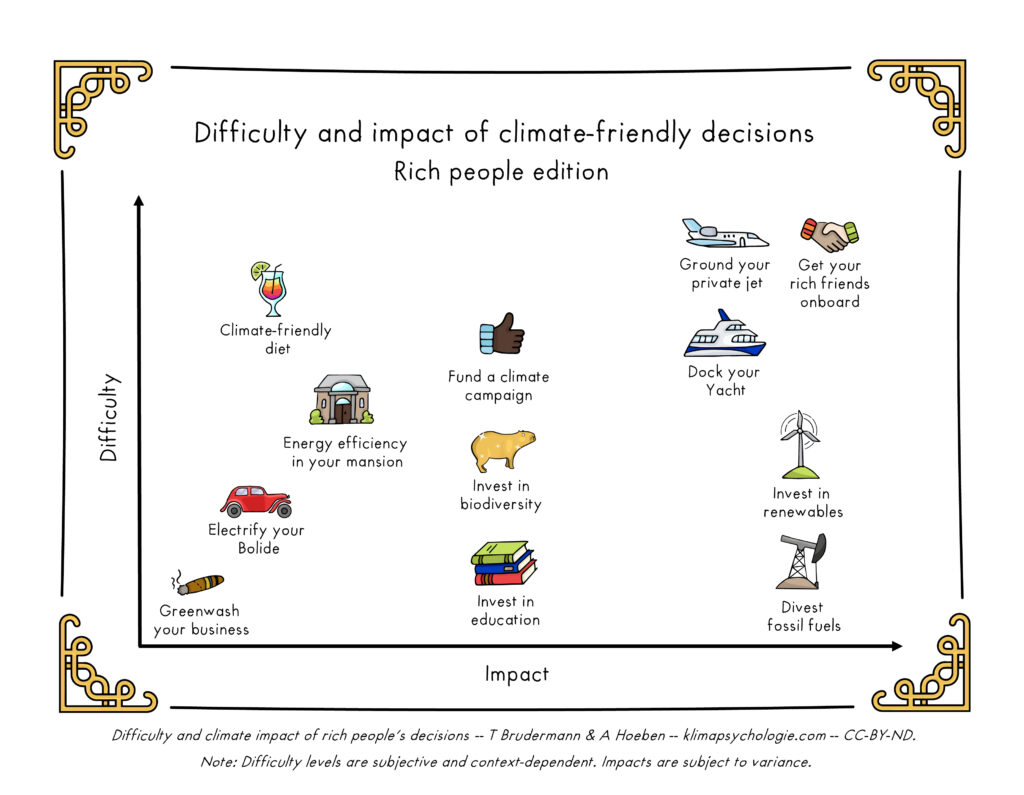
The difficulty levels of these actions are subjective. Actual impacts often depend on details and therefore may vary. The following are rough estimates on how much CO2 you may save per year. All units in metric tons, 1 ton = 1,000kg.
- Greenwashing your business: Zero. Actually, you might make things worse.
- Electrify your bolide: 0 – 2 tons
- Climate-friendly diet: 1 – 2 tons
- Energy efficiency in your mansion: 2 – 3 tons
- Dock your yacht: 500 – 1,000 tons
- Ground your private jet: 3,000 – 4,000 tons
- Invest in renewables: 25 – 6,000 tons, possibly more
- Divest fossil fuels: 400 – 420,000 tons, possibly more
- Get your rich friends on board for these measures: Massive potential
- Investing in biodiversity and education or funding a climate campaign also is helpful, the impacts however are difficult to quantify.
1,000 tons of CO2 is an abstract number, but to make it more relatable: This is approximately the amount of CO2 which a 500-hectare large beech forest can absorb in one year. And for some perspective: Per-capita emissions in European countries are currently around 5 – 10 tons of CO2 per year. To meet climate goals, annual emissions should go down to 2 -3 tons per capita.
For non-rich people with climate change worries such numbers can be quite frustrating. They give us a feeling of helplessness and a feeling that our contributions do not matter, as they are comparably small. However, in a global crisis, every single contribution is small, and this puts us into a dilemma: Everyone – every induvial, every company, every country – can claim that their contribution is small and does not make a difference. Even the U.S as the biggest historical polluter did not single-handedly cause climate change. Retreating to “my/our part is only minor” is a very tempting logic, but eventually disastrous for the cause.
So how about a more constructive approach and the following question: What can I do in my private life, what can I do in my job? And how can I get other people on board?
Calculations, elaborations and data sources
Electric cars
The assumption is that the reference person is buying a new car and chooses between a combustion engine vehicle or an electric vehicle. If the electric vehicle is chosen, the average Austrian emissions reduction amounts to around 732 kg CO2eq per year. This number has been calculated by using the emission factors for Austria (with a high share of renewables in the grid) from the Umweltbundesamt (2022) as well as production emissions from the Umweltbundesamt (2021). However, for rich people, the difference might be higher, as they tend to use fuel-intensive cars (Lynch et al., 2019) and have a motor vehicle use carbon footprint of 4.8 t CO2/year (Otto et al., 2019). Keeping the relative emissions reduction (22%) constant results in an approximate reduction of 1.1 t CO2/year, if you can make sure to charge the batteries with renewable sources such as Photovoltaics.
Climate-friendly diet
A climate-friendly diet could save around 1000 kg CO2eq per year. This number was taken from numbers provided by Schlatzer & Lindenthal (2020): The average omnivore diet results in 1467 kg CO2eq/year while the average vegan diet accounts for 439 kg CO2eq/year. Considering, however, that rich people have higher food emissions in general, the emissions reduction following a climate-friendly diet change will be higher for rich people, although it is difficult to say how much. However, the income elasticity of food is decreasing with higher incomes (Femenia, 2019) so the emissions reduction might be in the range of 1.5 t CO2eq/year but it’s hard to say.
Energy Efficiency in your Mansion
Otto et al. (2019) state household energy emissions of 18.9 t CO2eq/year for superrich households. Adan & Fuerst (2016) indicate household energy savings potentials of 13% though proper insulation and efficient heating. Based on these numbers we would end up with roughly 2.5 t CO2eq/year. If a rich household switches completely to renewable heating systems and electricity generation, the potential will be larger, however.
Divest from Fossil Fuels
According to Oxfam (Dabi et al., 2022), each billionaire’s investments produces on average 3 million t CO2eq/year. 14% of this is from so-called “high-polluting industries” (energy and materials). If these investments were cancelled, this results in an emissions reduction of 420,000 t CO2eq/year. Not every superrich person is actually a billionaire, but even just 0,1% of this number (ration of billionaire to millionaire) would still be of 420 t CO2eq/year.
Private jet
According to Otto et. al (2019), the air travel of a typical super-rich two-person household generates 66.5 t CO2eq/year. In this context, private jets are of particular importance. A study by the non-governmental organization Transport & Environment revealed that private jets are 5 to 14 times more polluting per passenger than commercial flights and 50 times more polluting than trains. In just one hour, a single private jet can emit two tons of CO2, while the average CO2 footprint of EU27 residents in 2019 was equivalent to 6.8 tons of CO2 per person.
According to Lynch et al. (2019) the 14,939 private jets in the US amounted to 55 million t per year, resulting in 3748 tons of CO2 per private jet per year. A recent study commissioned by Greenpeace illustrates the CO2 emissions of private aviation in Europe. In 2022, the majority of private flights covered distances of less than 750 km, with the Paris-London route being the most heavily traveled, averaging nine flights per day between the two cities (total of 3,357 flights emitting 9,629 tons of CO2 per year). Notably, there is a direct and regular train connection for this route that takes just under two hours. Also interesting: The countries in the EU27 (including Norway, Switzerland and the United Kingdom) with the highest number of private flights in 2022: United Kingdom, France, Germany (Austria ranked 7th). Top 10 countries in the EU27 (including Norway, Switzerland and the United Kingdom) with the highest CO2 emissions caused by private aviation in 2022: UK, France, Italy (Austria ranked 10th).
Yacht
Lynch et al. (2019) assessed the ecological footprint of “luxury commodities”, such as super yachts, super homes, luxury vehicles, and private jets. Among other things, they calculated CO2 emissions for super yachts (SYs), which are up to 70 meters long. However, the authors focused on SYs in use rather than their life cycle. They justify this as follows:
“In our effort to quantify SYs’ ecological impacts, we admit omitting their full ecological impacts and costs. For example, we were unable to estimate the volume of various materials (e.g., rare woods and metals) and the quantity of energy used to construct SYs. Our estimate focuses only on the carbon footprint of SYs in use and, as a result, drastically underestimates the full scope of the ecological disorganization generated by building SYs“. (p. 382)
Their numbers show: One average SY produces 2.1 million pounds (approx. 952.5 t) of CO2 emissions annually. Thus, one average SY produces as much CO2 pollution as 202 average cars. Globally, there are 300 SYs larger than 60 meters, with annual SY fleet carbon emissions of nearly 630 million pounds (approx. 285,763 t). This is similar to the annual emissions of entire nations, such as Burundi’s 10.6 million inhabitants.
Investment in Renewables
According to https://ourworldindata.org/safest-sources-of-energy, solar energy saves 485 t CO2eq per GWh (485 kg per MWh) of electricity produced, compared to natural gas. Assuming that the investment in solar energy reduces the need for natural gas electricity accordingly, and that the investment would be for a solar park of the average capacity in Austria (roughly 52 MWh according to https://pvaustria.at/wp-content/uploads/2023_Fact_Sheet_PV_Branche.pdf), the solar park would cut emissions by 25 t CO2eq/year. The potential is much bigger if the energy generated is used a substitute for coal or if the installed capacity is higher (for example, Austria’s largest solar park produces 12 GWh, so in this case the same calculation as above leads to 5820 t CO2eq/year.
Get your Rich Friends on Board
Not really quantifiable, but huge potential, especially if funds are divested from fossil fuels. The impact might even be position off the chart and can be considered the most important one.
Text and research by Jan Stalzer, Juliane Stumpf, Alexandra Lehner, Annechien Hoeben & Thomas Brudermann, Illustration by Annechien Hoeben
References
Adan, H., & Fuerst, F. (2016). Do energy efficiency measures really reduce household energy consumption? A difference-in-difference analysis. Energy Efficiency, 9(5), 1207–1219. https://doi.org/10.1007/s12053-015-9418-3
Dabi, N., Maitland, A., Lawson, M., Stroot, H., Poidatz, A., & Khalfan, A. (2022). Carbon billionaires: The investment emissions of the world’s richest people. Oxfam International. https://doi.org/10.21201/2022.9684
Femenia, F. (2019). A meta-analysis of the price and income elasticities of food demand. German Journal of Agricultural Economics 68, 77-98.
Lynch, M. J., Long, M. A., Stretesky, P. B., & Barrett, K. L. (2019). Measuring the Ecological Impact of the Wealthy: Excessive Consumption, Ecological Disorganization, Green Crime, and Justice. Social Currents, 6(4), 377–395. https://doi.org/10.1177/2329496519847491
Otto, I. M., Kim, K. M., Dubrovsky, N., & Lucht, W. (2019). Shift the focus from the super-poor to the super-rich. Nature Climate Change, 9(2), 82–84. https://doi.org/10.1038/s41558-019-0402-3
Schlatzer, M., & Lindenthal, T. (2020). Einfluss von unterschiedlichen Ernährungsweisen auf Klimawandel und Flächeninanspruchnahme in Österreich und Übersee.
Umweltbundesamt (2021). Die Ökobilanz von Personenkraftwagen. URL: https://www.umweltbundesamt.at/fileadmin/site/publikationen/rep0763.pdf Umweltbundesamt (2022). Emissionskennzahlen Datenbasis 2020. URL: https://www.umweltbundesamt.at/fileadmin/site/themen/mobilitaet/daten/ekz_pkm_tkm_verkehrsmittel.pdf